
Feature Catalogue
Logystera is for any JSON Log
From ingestion to alerting, every piece is designed for JSON audit logs (including Vault), multi-tenancy, and enterprise observability.
Contents
Signals, Rules, and Metrics for Your JSON Logs
Logystera extracts high-value operational and security signals from JSON audit logs using real-time ingestion, YAML rule definitions, and Prometheus metrics. Namespace-aware isolation keeps multi-tenant teams separated while still supporting Vault as the flagship example.
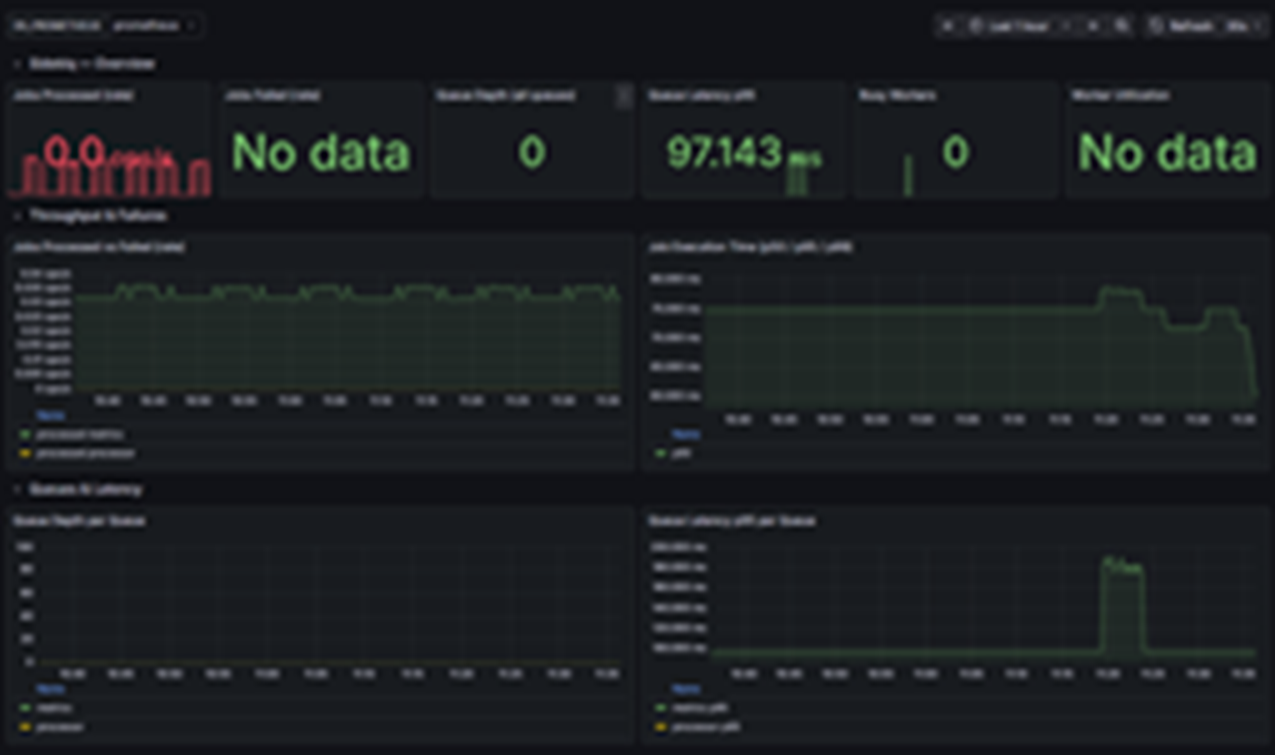
Blurred preview of the namespace-aware metrics and alerting dashboards shipped with Logystera.
Real-time ingest pipeline
File, Fluentd, or RabbitMQ with tenant/cluster labels on ingress.
- • Parallel forwarder/consumer/processor sized independently.
- • Backpressure-aware flow control for bursty audit streams.
YAML rules & metrics
Thresholds, windows, suppression, bundling without redeploys.
- • Dynamic labels from any JSON field for precise routing.
- • Versioned rules and metrics compiled into PromQL.
Multi-tenant isolation
Namespaces and tenants isolated by default.
- • Per-tenant dashboards, quotas, alerts, and rate limits.
- • Safe for regulated shared clusters.
Preview of alert bundling, suppression windows, and delivery outcomes exposed as metrics.
Alerting engine
Email, webhook, Slack with retry, dedupe, and suppression.
- • Bundling collapses bursts into actionable alerts.
- • Alert outcomes and suppression state exposed as metrics.
Prometheus metrics
Multi-registry /metrics tuned for low-latency scrapes.
- • Counters, gauges, histograms compiled from YAML metrics.
- • Throughput, latency, queue depth, alert outcomes, registry health.
Redis-backed state + workers
Low-latency state with parallel evaluation.
- • Redis stores windows, dedupe keys, suppression lists with <5ms access.
- • Sidekiq/worker parallelism with detailed worker metrics.
Identity-aware detection
Vault-native semantics with extensible JSON parsing for any source.
- • Pre-built coverage for Vault tokens, entities, namespaces, leases, auth flows.
- • Extendable to Kubernetes, CI/CD, APIs, and any structured JSON system.
On-prem PKI-ready pipeline
Built for private networks and air-gapped environments.
- • Private PKI for mTLS between agents, services, Redis, RabbitMQ.
- • No external dependency; deploy in high-security environments.
Everything Shipped Out of the Box
A complete list of capabilities to deploy, observe, and alert on modern workloads.
- 1Real-time log ingestion: file, Fluentd, RabbitMQ; 40M+ entries/day with on-the-fly tenant, cluster, and node labels.
- 2Distributed pipeline: forwarder, consumer, processor, metrics engine, and UI are decoupled and independently scalable.
- 3YAML rule engine: thresholds, windows, suppression, and bundling; hot-reload without redeploy.
- 4Custom metrics: YAML definitions with dynamic labels from any JSON field; counters, gauges, histograms compiled to PromQL.
- 5Prometheus integration: multi-registry, deduped /metrics endpoint tuned for high scrape rates.
- 6Identity-aware anomaly detection: failed auths, privilege jumps, token spikes, misuse, and time-window correlation.
- 7Multi-tenant isolation: separated rules, labels, metrics, pipelines; safe for hundreds of tenants.
- 8Namespace-aware monitoring: activity, auth, secrets usage, and errors split per namespace.
- 9Alerting engine: email, webhook, Slack with bundling, rate limits, suppression, retries, and counters.
- 10Redis-backed state: rules, metrics, windows, dedupe keys, suppression lists stored for low-latency operations.
- 11Advanced log processing: deep flattening, sanitization, and semantic extraction to meaningful Vault events.
- 12Sidekiq parallelism: high-concurrency processing with C-backed parsing and label extraction; detailed worker metrics.
- 13Metrics for everything: queues, processing latency, workers, alert outcomes, throughput, backpressure, registry size.
- 14Built-in web UI: health, metrics, tenant status, and config validation for operators.
- 15Analytics packs: token lifecycle, leases, auth events, unauthenticated events, error surfaces, request hot spots.
- 16Grafana dashboards: structured, namespace-aware, cluster comparisons, auth flows, operator performance.
- 17PKI/TLS tooling: CA, intermediate, client, and server certs per component; separate trust domains for white-label installs.
- 18On-prem agent: Fluentd-based with buffering, retries, and backpressure for air-gapped or regulated networks.
- 19Test/dry-run mode: validate new rules on existing logs without triggering production alerts.
- 20Alert bundling and dedupe: aggregate bursts into concise, actionable alerts.
- 21Tenant quotas and limits: cap ingestion volume, rule complexity, and alert throughput per tenant.
- 22Self-healing pipeline: backpressure-aware consumers adjust ack rate to survive spikes without loss.
- 23Versioned rules: IDs and versions for auditability when rules change.
- 24Everything YAML-driven: tenants, rules, metrics, pipelines, dashboards are version-controlled and transparent.
Ready-Made Views for Ops and Security
Platform and tenant-level dashboards with alert outcomes, suppression state, and namespace isolation.
Platform view
Compare clusters, namespaces, and tenants with structured PromQL. See auth methods, token behavior, mounts, and error hot spots.
- Namespace isolation baked in.
- Auth and token lifecycle analysis.
- Operator performance and regression views.
Tenant view
Safe, isolated dashboards for each tenant or business unit with KPIs for chargeback and compliance.
- Requests and errors per namespace and path.
- Mount and KV usage relevant to that tenant.
- Alert outcomes and suppression state.
Map these features to your Vault setup
We will review your namespaces, auth methods, and current monitoring, then suggest which packs and alerts to enable first.
Feature Details That Keep You Fast and Quiet
Clear examples of how Logystera avoids cardinality explosions, suppresses noise, and stays Vault-smart while remaining source-agnostic.
Multi-registry /metrics tuned for low-latency scrapes
Per-tenant metric registries prevent cardinality explosion.
The Problem: Combining all metrics into one registry in multi-tenant environments creates cardinality blow-ups and slow scrapes.
Logystera's Solution:
- Prometheus scrapes only relevant metrics per tenant.
- No cross-tenant metric pollution.
- Faster scrapes and queries.
- Clear cost attribution per tenant.
Thresholds, windows, suppression, bundling without redeploys
Intelligent alert management reduces noise by 60%.
The Problem: Traditional alerting creates fatigue—too many alerts, too much noise.
Logystera's Solution:
- Bundling: Related alerts grouped into one notification.
- Suppression: Avoid re-alerting for known issues.
- Windows: “Alert only if X happens Y times in Z minutes.”
- Hot-reload: Change alert rules without restarts.
Real impact: Teams report ~60% reduction in alert volume while catching more real issues.
Vault-Native Semantics
Deep understanding of Vault-specific concepts with extensible JSON parsing for any log source.
What this means: Pre-built rules for Vault, easy customization for K8s, CI/CD, APIs, or any system that writes JSON.
For Vault:
- Token lifecycles and expiration patterns
- Entity relationships and identity flows
- Namespace isolation and quota tracking
- Lease management and renewal patterns
- Auth method behavior and failures
For Other Systems:
- Kubernetes: Pods, namespaces, RBAC events
- CI/CD: Pipeline stages, artifacts, deployments
- API Gateways: Routes, auth, rate limits
- Any system writing structured JSON logs
We trimmed alert fatigue by 60% because suppression and bundling are baked into the platform.

Identity-aware metrics finally made namespaces and entities visible across teams.
Grafana was plug-and-play; we shipped tenant dashboards in a day without touching code.